Using Data to Inform
My experience has taught me that while teacher instinct is invaluable, it is only bolstered when pairing it with data from the individual students as it relates to program-level goals. As such, my guiding question with data is always, “How does this inform instruction?” Below are samples of using data to inform decisions at various levels:
- Looking at Data
- Program-level Data Analysis
- Informing Instruction
- Lexical Load Example
- Early Literacy Example
- Action Plan
- Action Research Example
Looking at Data
 Gathering Data in One Place
Research is clear that using a combination of formative and summative assessment data to inform instruction yields the best student results. As such, it is important to have access both kinds of data. As a small district, my current program did not have access to centralized student data. The director of Teaching Learning and Innovation and I co-created student data sheets that housed formative and summative assessment along with WIDA-inspired ELL learner profile data.
Click to see a sample of the Data Sheets
Protocol for Looking at Data
The Teaching Learning and Innovation department led a series of PDs for teachers using SRI’s ATLAS-Looking at Data or Data-Driven Dialogue Protocol. With all the data in one place and a protocol with prioritized standards to follow, teachers have been able to participate in PLCs and respond effectively to the following questions:
- What do we expect our students to learn?
- How will we know they are learning?
- How will we respond when they don’t learn?
- How will we respond if they already know it?
Program-level Data Analysis
It goes without saying that in order to communicate effectively with stakeholders and make decisions about things like staffing and service model adjustments, it’s important be able to look at program-level data and analyze below for patterns. It is only through understanding the WHAT and WHY, that we can take ownership of the HOW and make informed, impactful decisions.
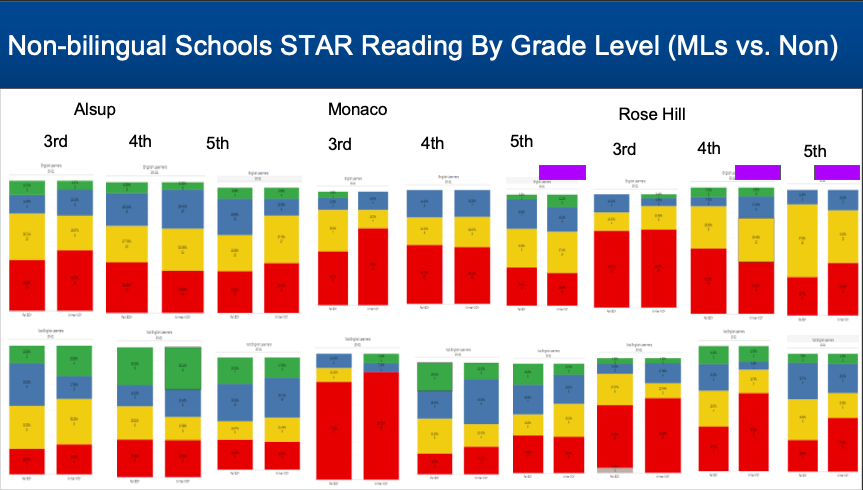 During remote learning during COVID 19, our department investigated reading data and to determine next steps in supporting our district’s 3,500 language learners. Our analysis uncovered gaps in Kindergarten instruction and also unearthed grade-level and building level instructional assets, which allowed us to both address the instructional concerns and build off the great things being done in individual classrooms. The analysis led to changes in district support that facilitated growth in ACCESS scores and an increase in student engagement measured by surveys and classroom walkthroughs.
Reading and Math Data Multilingual Learners Mid Year 2021
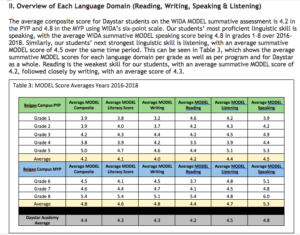
Below is a two-year analysis of Daystar Academy’s ELLs in terms of baseline proficiency, growth and exits. This analysis enabled me to shift our service model from a largely stand-alone streaming model to co-teaching and targeted pull-outs. It also allowed me to staff effectively and shift programming to more reading and writing instruction.
Daystar Academy Language Learner Summary 2016-18
Informing Instruction
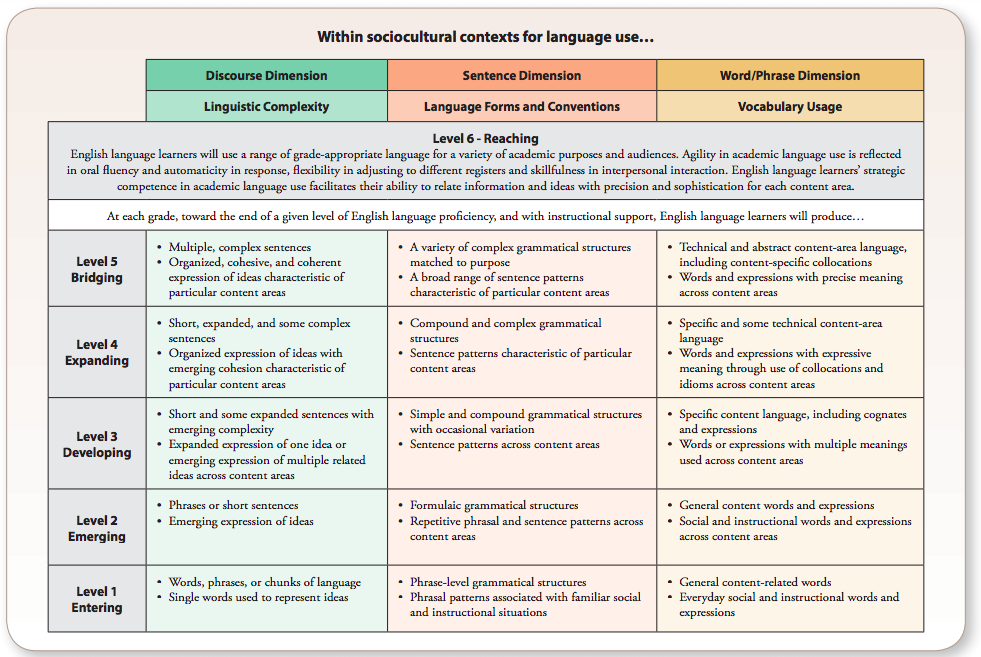 To modify my own instruction, I use formative and summative data from student data sheets, ELL learner profile data and prioritized standards and learning targets. Specially, analyze prioritized standards and content using WIDA Performance Definitions to determine linguistic complexity. I then analyze student data and WIDA level, along with WIDA Can Do Descriptors and to design WIDA MPIs and equitable and effective instruction that is a best-fit for student language proficiency.
Lexical Load Example
In one example that comes to mind, using WIDA Performance Definitions I was able to determine that my WIDA level 2s were struggling with a lexical load that was too high for them. To remedy this, I was able to find reading material that used the same Tier 2 vocabulary as the language arts anchor text, but with a much lower lexical load. Thus, these students were exposed to grade level concepts and vocabulary that was within their Zone of Proximal Development. Students developed the same comprehension sub-skills as their peers (determining main idea and detail) using supports from the MPIs (leveled text, sentence frames, and word banks with the support of a peer). In this manner, I kept the rigor high as well as the accessibility.
View a sample of MPI strand used.
View a sample of leveled reading.
Early Literacy Example
Another example that comes to mind is an early literacy example in grades 1-3. Our students’ MAP reading scores for grades 1-3 weren’t progressing as much as we had expected after adopting a new curriculum. Digging into the MAP learning continuum data showed us a trend of a large group of students struggling at the phonics level. Responding to this, we gave this group of students individualized phonics assessments and were able to determine gaps in decoding skills. From there, we were able to dynamically group students and further target their phonics instruction to fit the needs of those gaps during our guided reading times and literacy centers. For students who still needed more help, we were able to set up short-term literacy interventions managed by ELL teachers and para-educators. This increased targeting of specific decoding skills to specific students led to much more efficient progression of decoding proficiency for our ELLs.
Action Plan
Using the PLC question format (above), educators are often are faced with determining what to do when students aren’t hitting the learning targets we are setting. When making revisions to our instruction isn’t enough, we sometimes need to do interventions or make action plans for individual students. In this example, this student was scoring far below his peers in reading, he wasn’t producing much writing and the literacy instruction in the classroom just wasn’t working. To approach this, the teacher and I assembled reading data and five writing samples. After analyzing the writing samples using the WIDA Writing Rubric, we were able determine that this student was struggling at the vocabulary level. We were also able to identify specific gaps in decoding skills. Reaching out his parents and using a combination of resources, we were able to put together an action plan that addressed vocabulary-building, specific decoding gaps, and moving from sentence-level to phrase-level writing. The plan helped this student find purchase and he made significant leaps in all three areas. We were then able to revisit the plan, make adjustments to the goals based on his work and roll out a second round. After two cycles, I’m happy to report that he is no long on an action plan!
Action Research Example
 A district I worked for in the U.S. encountered a huge influx of low-level English Language Learners (ELLs), the majority of which were WIDA level 1s and 2s (newcomers). The district was at a loss as to how to proceed. Continue the current model (co-teaching and push-in)? Shift to pull-outs? How much?
As there is not a lot of research regarding newcomers or SLIFE and service models, I performed an 8-week action research study comparing two service models: co-teaching and push-in; targeted pull-out with push-in support. I was able to determine that targeted pull-out with a sheltered instruction model was a better fit for these students as they made larger strides in decoding, comprehension and writing development. As a result, we were able to shift to this model until the students were able to pass beginning of the year benchmarks. At that point, we were able to shift back to co-teaching and a push-in more effectively.
- A summary of the study can be found here.
- The summative data can be found here.
- The full data set can be found here.